Must-do Unit Economics analysis for a Startup — Part 2
A deeper dive into Cohort Economics

A deeper dive into Cohort Economics
One of the first few posts I wrote on this blog was about what basic metrics to track and project in your business plan. While these metrics are still one of the first few things I would look at for a deal in our pipeline or even for our portfolio, there is an even better way of keeping a good track of health of your company’s business: Cohorts
I suggest you proceed from this point onwards only if you have read the first post. It takes 5 minutes.
There are a few reasons I am re-opening up the book on unit economics today.
Firstly, as a CEO/CFO/CBO, you need to know your business’ numbers like the back of your hand. It’s very important if you are struggling to take the business off the ground. But it’s even more important if you are growing every month. You need to make sure you are close to the breakeven point on your customer always, a milestone easy to forget when caught in the gold-rush.
Secondly, with cohorts you get an unaggregated view of your customers, piercing through the fogginess that averages cook up in your metrics.
Thirdly, most board discussions I have had this year hardly brought this stuff up. It’s partly to do with how much time there is during these board discussions. And partly (this being my conspiracy theory) a lot of people in the boards just want to close one eye towards bad economics. I am not yet sure why but probably to avoid confrontation.
Fourthly, this is all very close to my heart. Just over 5 years ago I was a bootstrapping founder, running a profitable company and growing every month. I did not have the luxury of VC dollars supporting my burn regardless of whether I make money from my customers or not. It’s difficult for me to get out of that mindset easily and over the years I have had to learn how to strike a balance between economics and growth. Done right, you can build some of the best businesses on this planet, with full control (almost) over your company. Slip up, and your shareholders will be on top of you and it happens to the best of us. See Flipkart or even Snap.
I usually divide cohort economics into two parts: Growth and Profitability. Today we’ll cover Growth.
Revenue Cohorts
Let’s start with steps for making Revenue Cohorts
- Create a n x n matrix with n being the time since you have customers
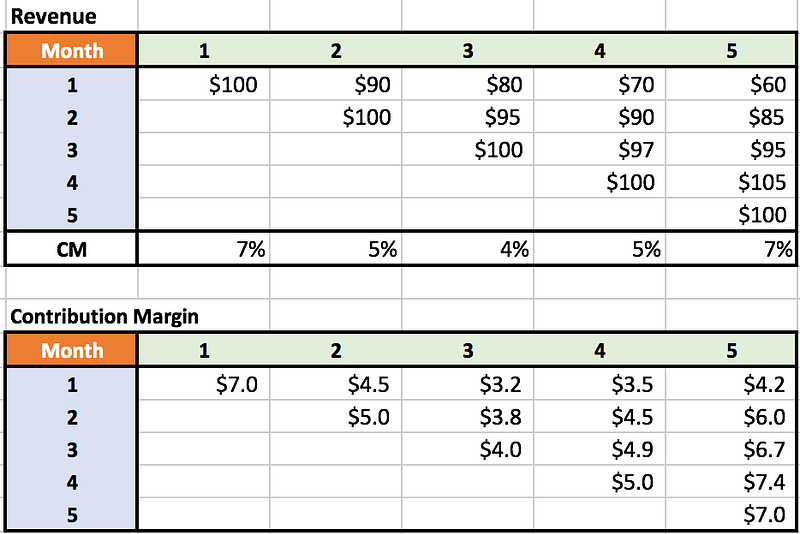
- You’ll be filling up the upper-right diagonal section with numbers such that each cell Cxy (x being row and y being column) represents the revenue acquired in month Y from customers acquired in month X

Taking a very simple example above of a 5-month year old company Startup Z, Cell C12 (row,column) = $90 represents the revenue generated by the company in Month 2 only from customers acquired in Month 1. And so on.
Contribution Margin Cohorts
What about Contribution Margin Cohorts?
- Simply find your monthly CM % (pre-CAC) and add it as a row at the bottom to the Revenue table
- Then multiple each column numbers with the corresponding CM % as the CM only changes month on month based on your operating costs that month

Tracking Metrics
Now that you have these numbers what more can you understand about your business suddenly?
1. Customer Retention
This is the top metric that every business should be tracking. How many customers do you retain every month? How much revenue do you retain from them every month? Losing customers is a bad thing, but losing revenue is even worse. In fact, it might be possible for a business to lose customers but still have good revenue retention. That’s fundamentally a good business to have as you make more money from fewer customers. Think Workday, the Sales reps need to close a couple of customers a year and they are sorted.
The company above seems to be getting better over time at retaining revenue. While for the customers acquired in Month 1 the company only retained 60% of the revenue by end of Month 5, for Month 3 customers the company managed to retain 95% of the revenue by end of Month 3. That’s a sign of a healthy business.
2. Revenue Churn
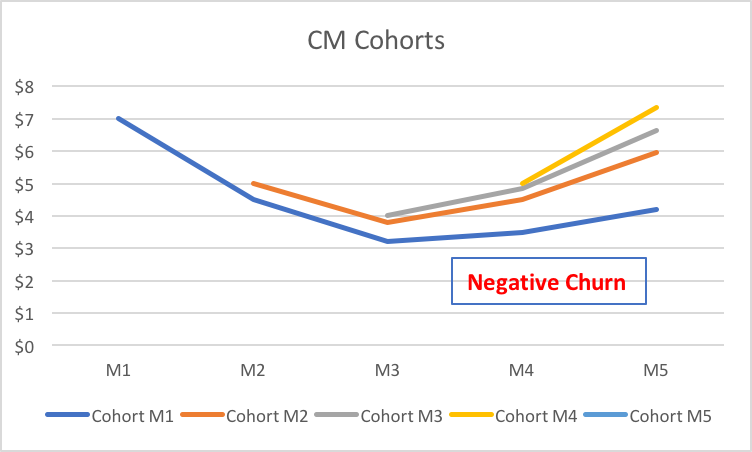
What is even more important to notice in the contribution margin table is Churn. This company has managed to achieve negative churn in revenue in Month 4. Contribution margin churn is negative for most months, but that’s a combined factor of improved efficiency (CM % grew higher) and revenue retention.
Negative churn businesses are beautiful businesses and the only way to generate truly exponential growth. While it is and should be quite common in a SaaS business, it’s usually difficult to see in a transactional business such as eCommerce. This is the primary reason for subscription eCommerce companies such as Stitchfix doing so well.

3. Lifetime Value
This one is a bit complicated as Lifetime Values are difficult to predict. However with the contribution margin charts you can actually regress the CM numbers over time and try to come up with a 2/3 year lifetime value. I’ll leave this for another day as the regression models can become a bit advanced and justify an independent blog post.
If you are not already tracking your cohorts on a monthly basis then I suggest you start now. The next post on profitability cohorts should give you an even bigger nudge.
